Los Angeles County's housing market has gone ice cold. In April 2026, the Market Hotness Demand Score dropped to just 13.00—the lowest reading since data collection began in August 2017. To put that in perspective, the market scored 89.73 in January 2018, meaning buyer demand has plummeted by 85% in just over eight years. This isn't a cooling trend; it's a full collapse in purchasing enthusiasm. The score measures how quickly homes sell and how much online attention listings receive, making it a real-time gauge of whether anyone actually wants to buy. Right now, the answer is a resounding no.
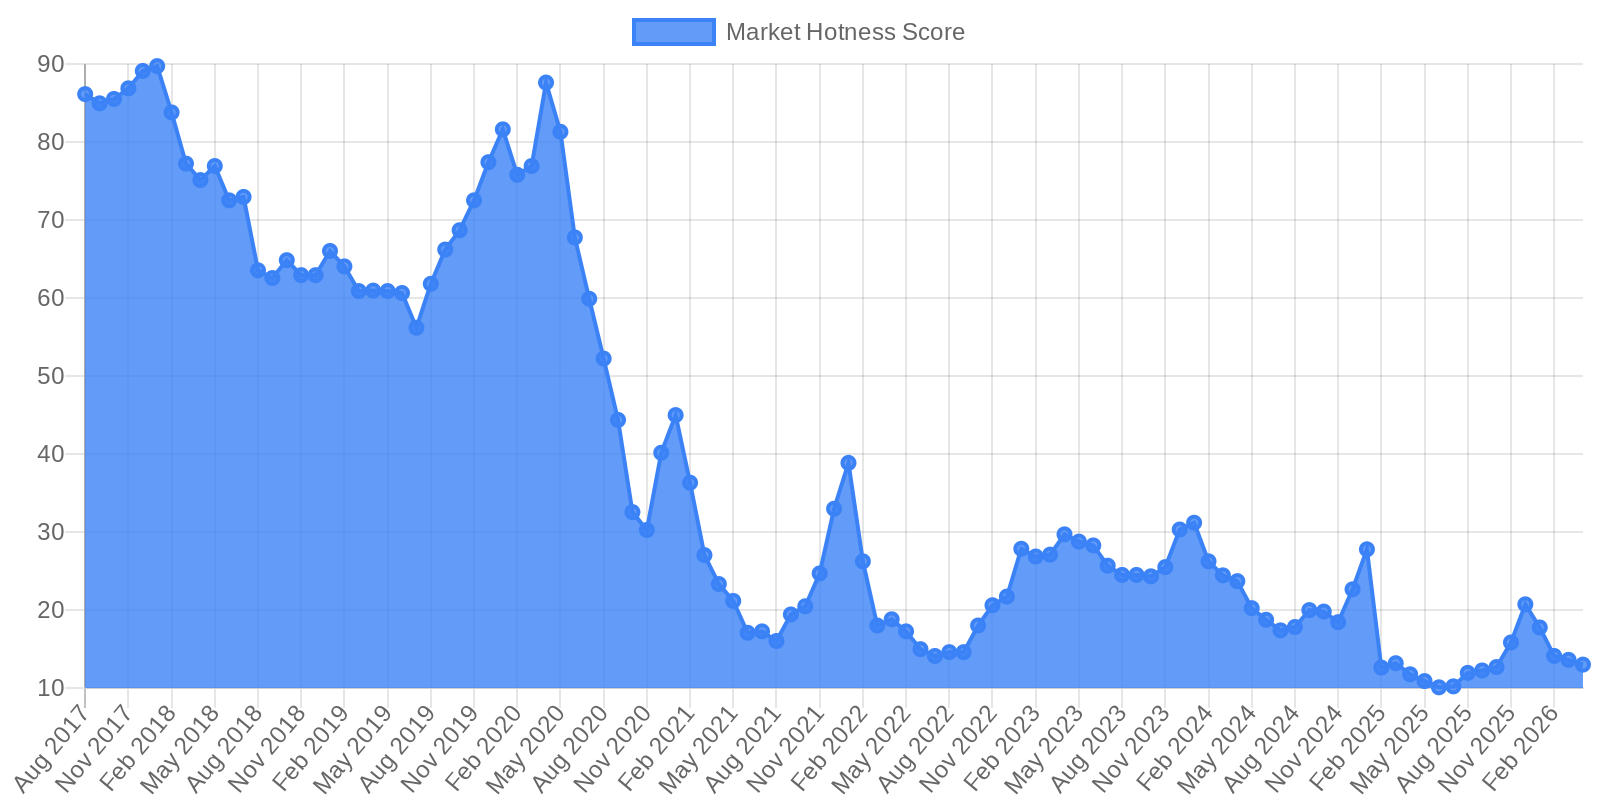
Los Angeles County's Market Hotness Demand Score has collapsed from a peak of 89.73 in January 2018 to just 13.00 in April 2026, reflecting an 85% decline in buyer enthusiasm and market activity over eight years.
The chart tells a story of three distinct eras. From August 2017 through early 2018, demand stayed hot with scores consistently above 72, peaking at 89.73 in January 2018. Then came a steady decline through 2018 and 2019, bottoming around 56 before rebounding through late 2019 and early 2020. But the pandemic broke everything. After a brief spike to 87.62 in April 2020, demand cratered—dropping from 81.31 in May 2020 to just 30.26 by November 2020, a six-month freefall of 51 points. The market briefly recovered during the pandemic homebuying frenzy, then collapsed again starting in mid-2021. From 44.99 in January 2021, it fell to 16.03 by August 2021. Demand has remained stuck in the teens and twenties ever since, with occasional blips upward. The latest reading of 13.00 in April 2026 marks a new all-time low, preceded by months in the 10-15 range throughout early 2025. Even seasonal bounces—like the December 2025 reading of 20.73—can't lift the market out of its deep freeze.
The demand score reflects factors like days on market, inventory shifts, pricing shifts, and unique listing page viewers per property, essentially measuring whether buyers are actively looking and how fast homes move. A lower score indicates a softer (cold) housing market, while a higher score indicates a stronger (hot) housing market. What's driving LA's unprecedented chill? Multiple forces are converging. First, median time on market has stretched to 32 days in LA County as of February 2026, and sales volume in LA County is down 6% from 2025 as of February 2026. While mortgage rates have improved—statewide rates averaged 6.05% in February 2026, down from 6.84% a year prior—the fundamental problem remains affordability. Home prices have held remarkably firm despite weak demand, creating a standoff. LA County's median price dropped 4.2% month-over-month to $842,660 and is also down 1.1% year-over-year, but these modest declines haven't been enough to unlock the market. Meanwhile, for-sale inventory is at highest levels since 2020, providing more options for buyers though still below historical norms. The result? Buyers are waiting for better deals, sellers are reluctant to accept lower prices, and transactions are grinding to a halt.
This demand drought reflects a market searching for equilibrium after years of whiplash. The question now is whether a score of 13 represents the bottom or if there's room to fall further. Economic factors suggest a recession-like turndown in 2026 due to a decline in jobs, with property prices expected to follow and fall, which could push demand even lower as job losses mount. However, limited supply (still below historical norms), strong job markets, and continued population demand support prices, with most forecasts predicting modest appreciation of 1-4% rather than significant declines. What's clear is that LA's housing market has fundamentally reset. The days of bidding wars and instant sales are long gone, replaced by a buyer's market where patience—and negotiating power—finally matter again.